Majora's Mask - Debug Code
This was taken directly from: http://www.jaytheham.com/zcw/Majora's_Mask_-_Debug_Code
The debug code for MM also debuted on The Oddesy of Hyrule, but this time was discovered (in an overly complex form) by Zero Enna.
Contents
Instructions
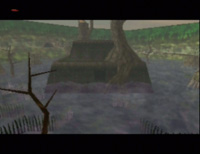
- Using the Crooked Cartridge trick, or another method (see Misc. glitches section), crash the game.
- What is being displayed on screen may change after the game is crashed, but a small red line should be visible in the top left corner of the screen.
- Now input the Debug code:
- Press the following buttons: Control pad LEFT + "C" RIGHT + L button + R button + Start button.
There is no order or timing necessary, once all the buttons are depressed at once the debug screens will appear.
And now an explanation of the debug screens by dvdmth:
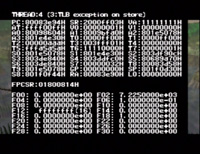
Register Information Screen
Both OoT and MM use the same first screen. This is the most important one, as it provides the most basic information concerning the status of the system at the time of the crash. Most (if not all) of the information shown comes from a register, either on the System Control Processor (top), the main CPU, or the Floating-Point Uni (bottom).
At the upper-left corner is that ID of the faulting thread. Often, different pieces of code will "take turns" using the CPU. Whichever piece of code, called a "thread," was being executed at the time of the crash is displayed. This number is usually 4, but not always. (I'm not sure where this number is stored, be it in a register or somewhere else.)
The top of the screen also shows the type of exception that crashed. Each exception has an associated number, between 0 and 31, that is used to identify what is going on. Note that not all exceptions result in a crash -- in fact, exceptions are a regular part of the life of the system. Those exceptions that actually cause a crash are known as "fatal exceptions" (for obvious reasons). It isn't until an exception becomes fatal that the debugger actually is invoked. (Sometimes an exception can crash one process while leaving others untouched, while other times an exception can bring everything to a halt. This is why sometimes you can still hear music after a crash, and other times you can't.)
Next, the debugger shows the values of three registers from the System Control Processor (a coprocessor that keeps track of system status and performs some basic system tasks). There are actually 32 registers (at least) on this processor, but only three are important.
- Exception Program Counter (EPC) - This is a pointer to the instruction that caused the crash. [Technically, the EPC holds whatever the Program Counter (PC) was set to at the time of the crash. The PC always points to the instruction currently being executed.]
- Status Register (SR) - This holds the status of the system, including what coprocessors are available and whether it's running in 32-bit or 64-bit mode (for example).
- Bad Virtual Address (VA) - This holds the memory address that the program tried to access and failed (assuming the crash is due to a memory error). On the N64, possible values range from $80000000-807FFFFF (with the Expansion Pak). Anything outside of this range is bad.
Beneath those three registers, the debugger displays 30 out of the 35 registers on the main CPU. Some registers, such as the Stack Pointer (SP), are used by the operating system to do its stuff. Others, however, are open for the program to use however it sees fit. The idea is to put the most often referenced data on a register, since registers are accessible at really high speeds (compared to RAM).
The only two registers I can identify in this group are the Stack Pointer (SP), which holds a pointer to the Stack (a section of memory that holds temporary data, like local function variables), and the "LO" register (which is used in multiplication and division operations).
Finally, the Floating-Point Unit (FPU) has its share of registers. The first register shown is the Floating-Point Control/Status Register (FPCSR), which keeps track of the status of the FPU, as well as providing any errors that occur during calculations. (The most recent error is displayed to the right of the value, if applicable. Note that this error is ONLY important if a Floating-Point Exception occurred.)
The remaining values show the various floating-point numbers being stored currently on the FPU. Floating-point numbers are numbers that have a fractional part (i.e. they have a decimal point). They are generally shown in scientific notation (instead of the usual hexadecimal), unless the value happens to be an integer. Only half of the registers are shown, since these are the only ones that actually hold data (for technical reasons). It is up to the program how to use these registers.
Majora's Mask Debug Screens
Majora's Mask has a more complex debugger and shows more stuff. This perhaps is due to MM's more complicated design and/or its use of the Expansion Pak.
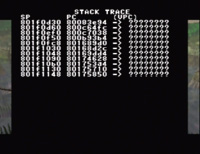
STACK TRACE #1
This is a more genuine trace. It keeps track of that the Stack Pointer (SP) is at various times during the game's operation. It also keeps track of what the PC was at that time (i.e. what line of code was running when the Stack was at that point). The first row shows the current SP and PC at the time of the crash. The farther down you go, the farther back in time you're looking. I have no idea what the last column is for.
In general, the smaller the SP value, the larger the Stack (the more stuff that's on it). This isn't 100% true, however. Once I saw the SP jump from $801xxxxx to $807xxxxx. (This probably happened because the Stack was getting too big for where it was, so the new data was placed on the Expansion Pak where it could fit.)
The number of lines on this screen vary, for reasons beyond my comprehension.
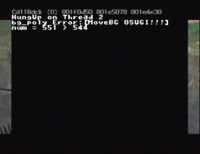
HUNGUP
This screen is uncommon but can appear. (I've only seen it after a crash in the defective Snowhead Temple with Epona.) The screen shows a second thread ID (usually 2, for some reason), as well as the source code filename responsible (such as "../z_std_dma.c"). This screen probably appears if the program crashed in a piece of code that had debug information embedded in it. I know from experience that if I have debug labels turned on when compiling and my program crashes, a debugger will report the filename and/or subroutine responsible for the crash.
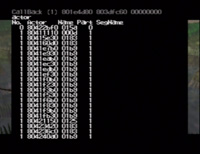
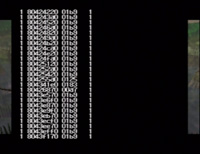
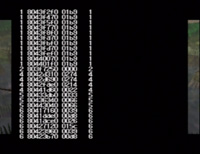
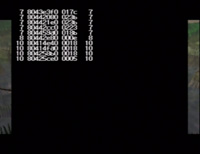
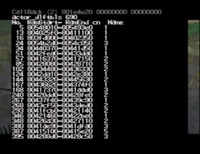
ACTOR LIST #1
This is similar to the second-to-last screen of the OoT debugger. This one, however, can potentially scroll onto additional screens (as many as three, perhaps more).
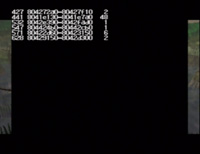
ACTOR LIST #2
A shorter version of the prior list. Its format is slightly different as well.
SCREENSHOTS
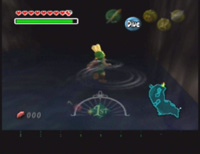
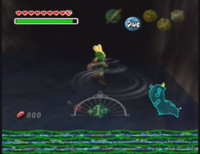
At this point, the debugger takes a moment to show two screenshots from the moments leading up to the crash. The last two frames drawn to the screen are displayed, with the most recent coming last. (The two are often the same image, with maybe a slight difference in one of the icons on the screen.)
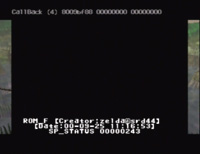
VERSION INFO
No debugger is complete without this, it seems. During development, there may be several different builds going around at once, so having a specific version dated can sometimes be helpful. Also on the screen is something labeled "SP_STATUS" (Possibly Stack Pointer Status?)
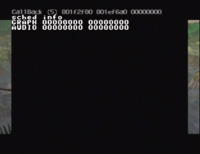
SCHEDULING INFO
This screen's a mystery to me. There are always two lines, GRAPH and AUDIO. However, sometimes another block of information appears, called RSPTask. What bugs me is that this last bit of information not only doesn't always appear, but sometimes decides to appear randomly during the same debug session! In other words, I'll visit this screen and not see it, then scroll through all other screens, coming back, and behold it's there!
Oh, and as for the purpose of this screen, it probably has to do with the special 3-day engine that schedules where characters should be at different times (either that or it has to do with cutscene activity).
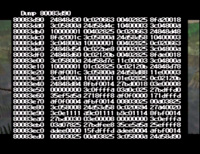
DUMP
This is the generalized version of the two dump screens of the OoT debugger. Here, you can examine anything that's stored in RAM. Here are the controls for the dump screen:
- Up, Down = scroll one line, or $10 (16 bytes)
- "A" + Up, Down = scroll a distance of $100 (256 bytes)
- "B" + Up, Down = scroll a distance of $1000 (4096 bytes, or 4KB)
- "A" + "B" + Up, Down = scroll a distance of $10000 (65536 bytes, or 64KB)
- C Down = Jump to the Stack (stack dump)
- C Up = Jump to the section of code that caused the crash (PC dump)
- C Left, C Right = scroll to $80000000 (start of RAM)
- START = exit the Dump screen
STACK TRACE #2
This is pretty much identical to the first Stack Trace, only the final column is different. On the first screen, in my tests, the third column was always "????????." However, on this screen, the ? marks were gone, and occasionally a different number appeared over here (in the range $8080xxxx, which isn't even part of RAM). I'm not sure why this happens or what the values mean, if anything.
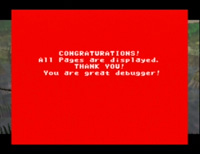
CONGRATURATIONS
Of course, the debugger has to provide some congrats for anyone serious enough to actually mess around with these screens. Notice how the word "congratulations" is misspelled. Was that intentional? After all, it is a debugger, so why should everything be perfect?
